NIR Spectroscopy for Food and Agriculture
NIR Spectroscopy for Food and Agriculture
KEYWORDS
• Food production
• Machine learning
TECHNIQUES
• Diffuse reflection
• Near infrared spectroscopy
APPLICATIONS
• Agricultural quality control
• Sugar and starch content
• Moisture determination
NIR Spectroscopy for Food and Agriculture
As population growth and limited arable land have strained the capacity to produce enough food, experts have stepped up efforts to explore and refine technical solutions that improve food production, quality and safety. In this application note, we describe how one such technology -- NIR spectroscopy -- helps to deliver objective data the food and agriculture industries are using to maximize quality and efficiency.
NIR Spectroscopy and Food Analysis
NIR spectra consist of broad peaks resulting from molecular vibrations caused by the interaction of molecules with light in the NIR wavelength region (~800-2500 nm). NIR spectra provide a snapshot of a sample, with information for multiple components available in a single NIR spectrum. A wealth of information can be extracted from the broad NIR peaks for the quantitative determination of chemical composition using tools such as chemometric modeling and machine learning.
NIR spectroscopy is a non-destructive technique that can be used to measure liquids and powders without the need for sample preparation. This is ideal for monitoring grains and other food samples during processing, where quantitative in- Unlocking the Unknown with Applied Spectral Knowledge. formation on parameters including fat, moisture and protein content is critical. As a result, NIR spectrometers are often integrated into online processes or configured as part of turnkey solutions for quality control and screening.
In the sections below, we’ll share two examples of how Ocean Insight modular NIR spectrometers can be utilized for analysis of agricultural samples and food products.
Back to the Garden: NIR for Soil Analysis
Determining soil characteristics such as moisture and nutrient content is important for farmers to ensure optimum crop placement and fertilization. Reflectance of rough surfaces such as soil can be used to identify different spectral features.
Reflectance is light incident on the surface of a material that is reflected at an interface. Light not reflected from the sample is absorbed, scattered or transmitted. Rough or matte surfaces like soil have diffuse reflectance, where the incident light gets scattered in all directions.
To test the sensitivity of an Ocean Insight NIR spectrometer for soil reflectance, we measured topsoil scooped up near one of our office locations. Our measurement setup consisted of a NIRQuest+1.7 NIR spectrometer (900-1700 nm), a high-power tungsten halogen light source, a 600 µm reflection/backscatter probe and a Spectralon® diffuse reflectance standard. OceanView 2.0 spectroscopy software completed the system.
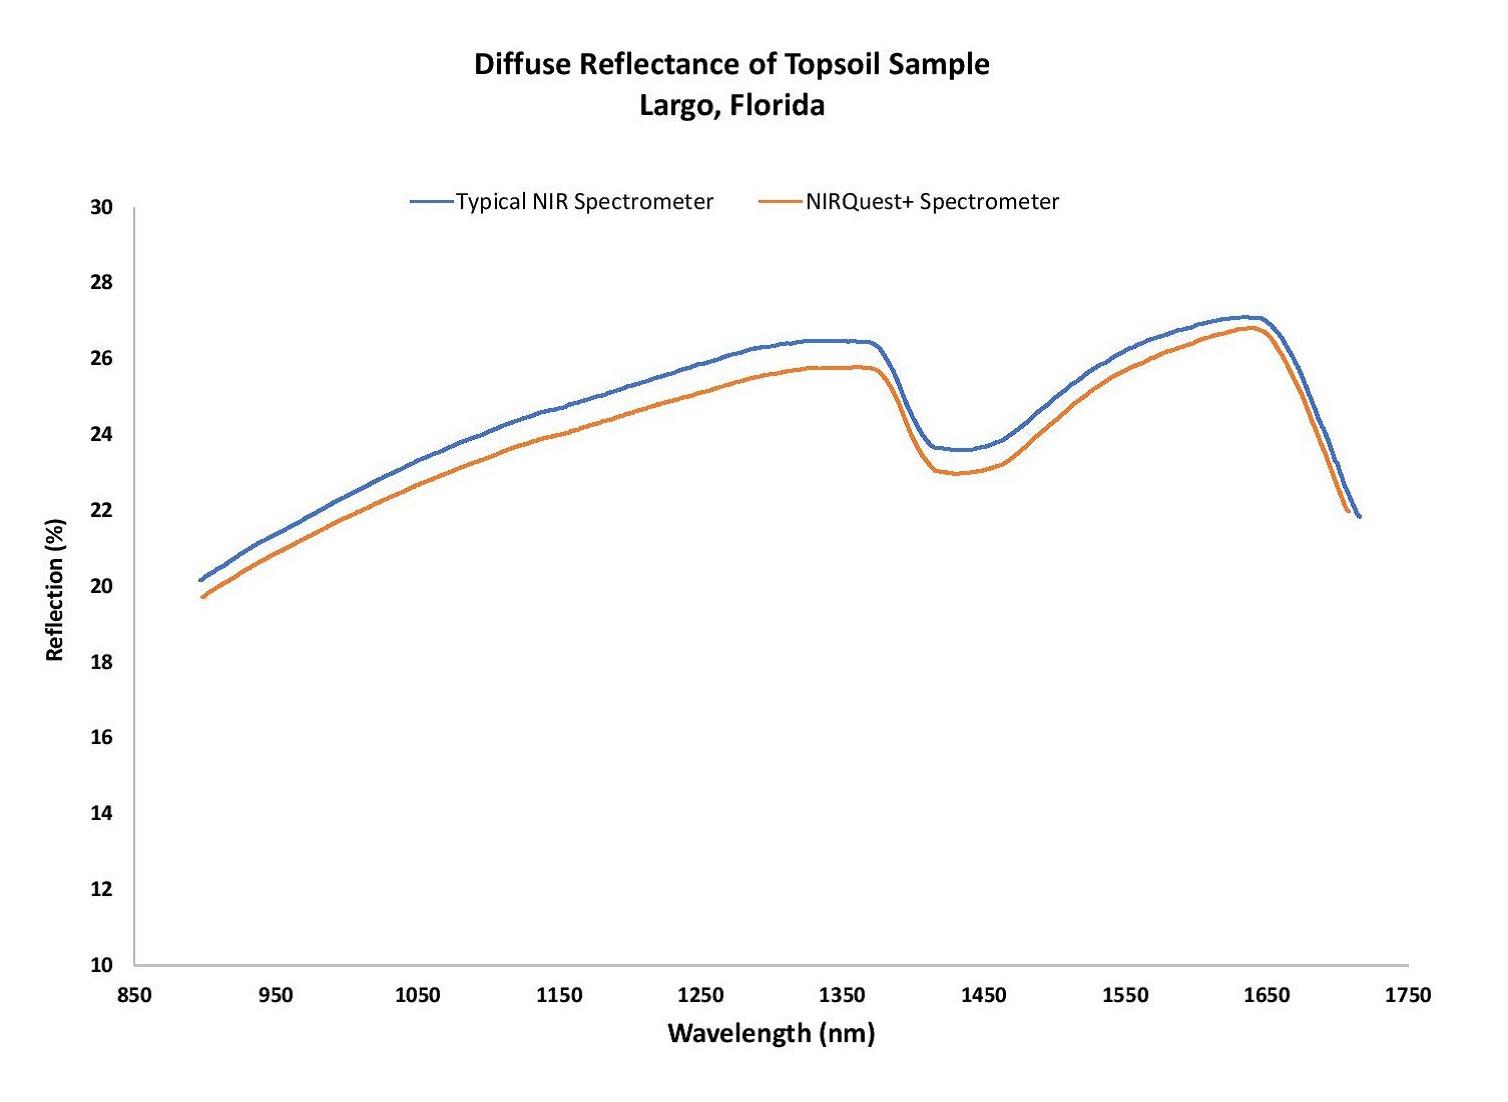
Figure 1. The NIRQuest+1.7 spectrometer measured distinct soil reflectance features from 900-1700 nm. Small movements in probe position and coupling differences caused the mismatch in the absolute levels of reflection.
Soil tends to have higher reflectance at NIR wavelengths, with its response dependent on variables such as surface features and soil composition. With the high-sensitivity NIRQuest+1.7 spectrometer, we measured the soil reflection at much lower noise levels than we could with a comparable NIR spectrometer; this low-noise data was especially noticeable at the ends of the spectrum. Even at spectrometer integration times as short as 5 ms, we captured distinct spectral features (Figure 1). With further chemical analysis and algorithm development, users could determine precise soil nutrient levels and predict fertilization needs.
Food for Thought: NIR for Produce Analysis
For fruit or produce covered by a peel, the longer wavelengths used for NIR analysis are weakly absorbed so they pass through the peel, enabling sampling of the fruit pulp beneath. Since its initial use in agriculture, NIR spectroscopy has evolved to encompass higher sensitivity instruments, more sophisticated sampling methods, and advanced machine learning tools to turn spectral data into actionable results.
Starch and sugar (primarily fructose, glucose and sucrose) are commonly measured to determine fruit maturity and quality. While the peaks for these constituents are similar, starch has specific wavelengths that enable construction of a multiparametric model for determination of fruit quality. An extended range NIR spectrometer like the Ocean Insight NIRQuest+2.5 works well for these measurements because it can detect critical starch peaks near 1722 nm, 2100 nm and 2139 nm, as well as sugar peaks that occur primarily between 900-1200 nm.
Sampling configuration is critical for these measurements. In addition to the spectrometer, a high-power Visible-NIR light source is necessary. Also, since much of the light will scatter off the surface of the fruit, a large core diameter fiber (600 µm) is recommended to increase throughput and improve sensitivity. Other considerations include water in the fruit that absorbs at NIR wavelengths and the non-uniform distribution of constituents within the sample. Regarding the latter, sampling over a large surface area of the fruit is recommended to provide an average value for the constituents in the fruit.
We measured NIR diffuse reflection of avocados and mangoes at four different locations on each sample. Multiple measurements were made due to the variable nature of fruit, to account for the effects of bruising, non-uniformity in color and differences in sugar content (due to differences in sun exposure). To account for the inhomogeneity and variations in the fruit surface, many more measurements should be made at different points on the fruit surface.
We observed that even spectra for the same fruit type showed variability across the spectral region, with the avocado more consistent in the region >~1100 nm (Figure 2). While the spectral features are similar for both types of fruit, differences in magnitude are observed throughout the spectra. Sampling additional locations on the surface of the fruit would help to average out variability for a given piece of fruit and improve the accuracy and repeatability of the results.
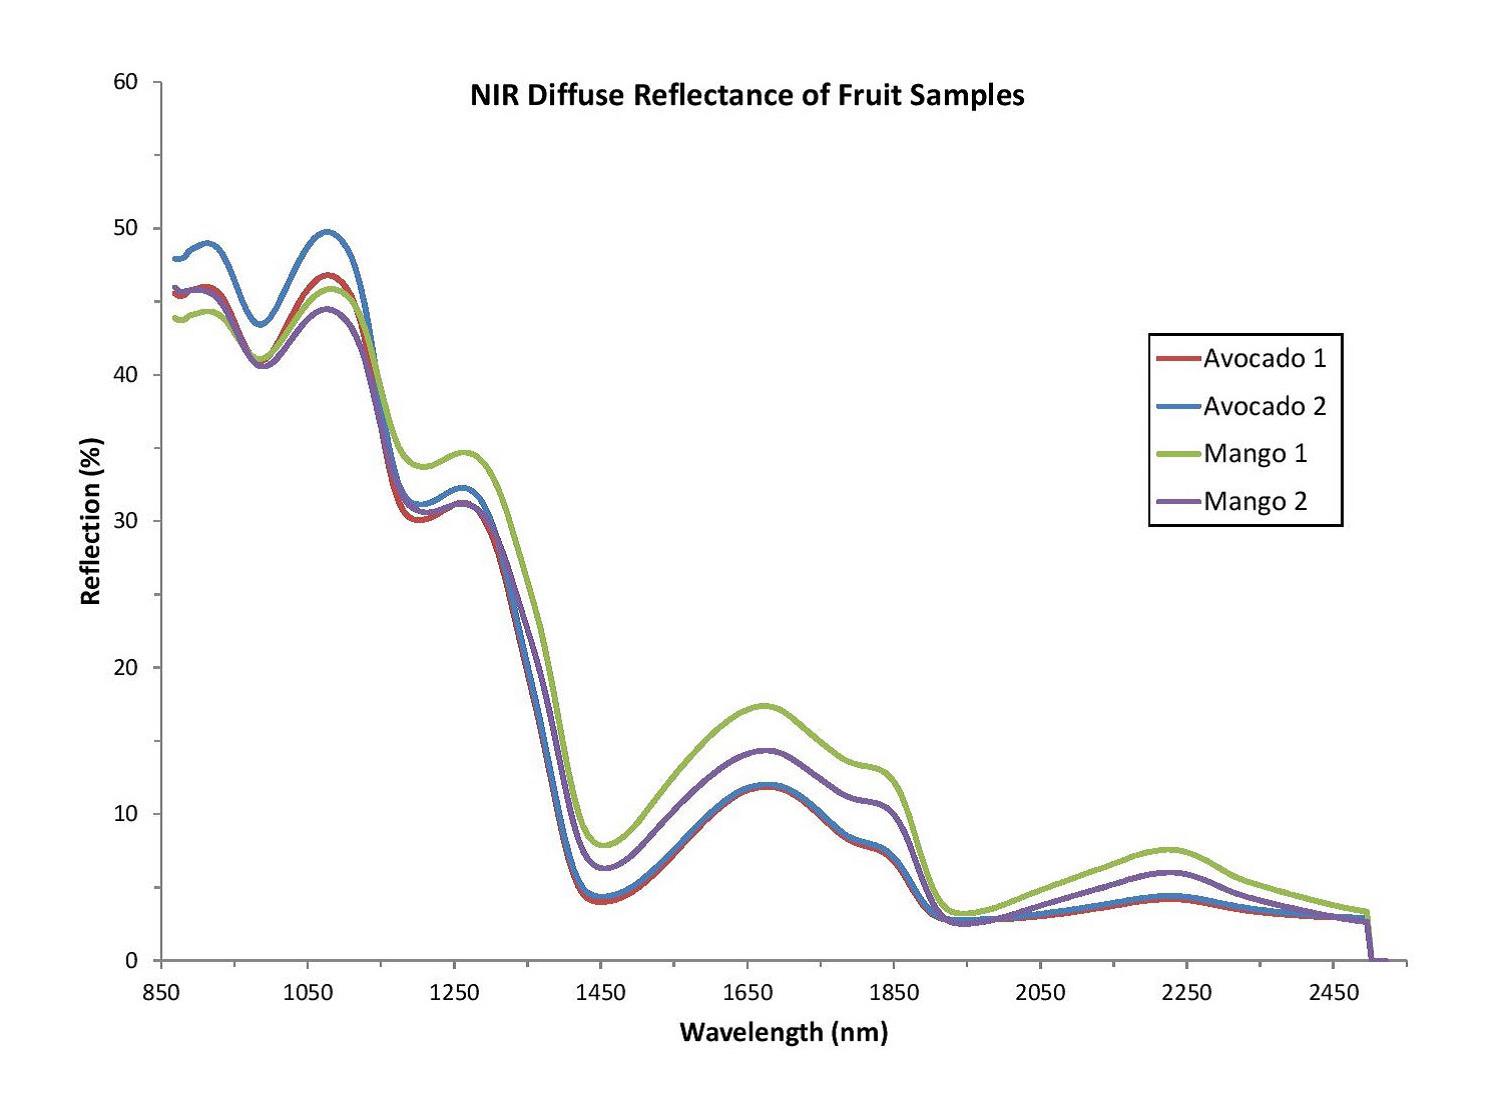
Figure 2. NIR diffuse reflection measurements of mangoes and avocados reveal spectral variability from sample to sample.
Fortunately, the speed of the NIR technique and the sensitivity of the NIRQuest+2.5 spectrometer allow users to sample a larger surface area of the fruit, and to make more measurements, without the need for lengthy measurement times. Essentially, the high sensitivity of the spectrometer equates to excellent signal-to-noise performance over shorter time frames, allowing for measurements on a fast-moving conveyor belt (such as in food sorting) or within a process stream.
Interpreting the Results: Machine Learning and More
While the results reported here are qualitative, carefully constructed chemometrics models or advanced algorithms would provide a multi-parameter, quantitative assessment of fruit quality. With a good set of reference spectra and PLS (partial least squares) modeling, a calibration model can be developed to measure multiple fruit parameters (sugar, starch and other fruit constituents) for the prediction of fruit quality.
For users dealing with massive or complex spectral data sets, Ocean Insight’s Ocean Intelligence machine learning platform provides quick characterization of incoming spectra and the potential to provide another layer of measurement insight. The system can be trained around known analytes and samples to classify unknown materials into the appropriate set, judge whether a sample passes some QC protocol, or output an analyte’s concentration. This can be done without the need for hand-developed spectral models and analysis, helping to reduce overhead costs, improve quality and provide a deeper level of assurance.
Summary
With improved spectral hardware and analytical tools, the food and agriculture industries can enjoy a deeper level of analysis that is not relying on the human eye and intuition but is rather folding its fingers through every digital bit of data, statistically analyzing the entire data array of each spectrometer scan at every pixel on the detector.
This system can now see abnormalities previously missed and develop smarter, more streamlined correlations for far more variables intertwined with one another.
Article Source: https://www.oceaninsight.com/globalassets/catalog-blocks-and-images/app-notes/nir-spectroscopy-for-food-and-agriculture_final.pdf