New Spectrometer Excels for Absorbance Measurements
New Spectrometer Excels for Absorbance Measurements
KEYWORDS:
● Spectrometer SNR
● Optical filters
● Potassium dichromate standards
TECHNIQUES:
● Absorbance
APPLICATIONS:
● Concentration measurements
● Optical filter characterization
In this application note, we evaluate the effectiveness of a CCD-array spectrometer for measuring the absorbance of optical filters and potassium dichromate solution standards. These standards often are used to qualify the photometric accuracy and linearity of spectrometers.
Since the introduction of the first commercially viable modular spectrometers in the early ‘90s, successive generations of these versatile instruments have demonstrated significant improvement across key performance indicators including signal to noise ratio (SNR), optical resolution, scan rates, stray light and linearity.
The SR2 spectrometer is at the vanguard of the newest generation of modern modular spectrometers. The spectrometer has a proprietary linear CCD-array detector, enhanced electronics that provide high-speed spectral acquisition (integration times to 1 μs), and excellent SNR performance for absorbance measurements, plasma monitoring and other applications. Here are some examples of SR2 performance for absorbance measurements.
Absorbance of Optical Filters
Using an SR2 spectrometer with a DH-2000-BAL deuterium-tungsten halogen light source and an optical filter holder, we measured various combinations of optical color, balancing and UV blocking filters. When compared with a similar type of spectrometer for the same measurements, the SR2 demonstrated higher absorbance values, suggestive of lower stray light performance; and better SNR at longer wavelengths, the result of more balanced spectral sensitivity across the spectral range (Figure 1).
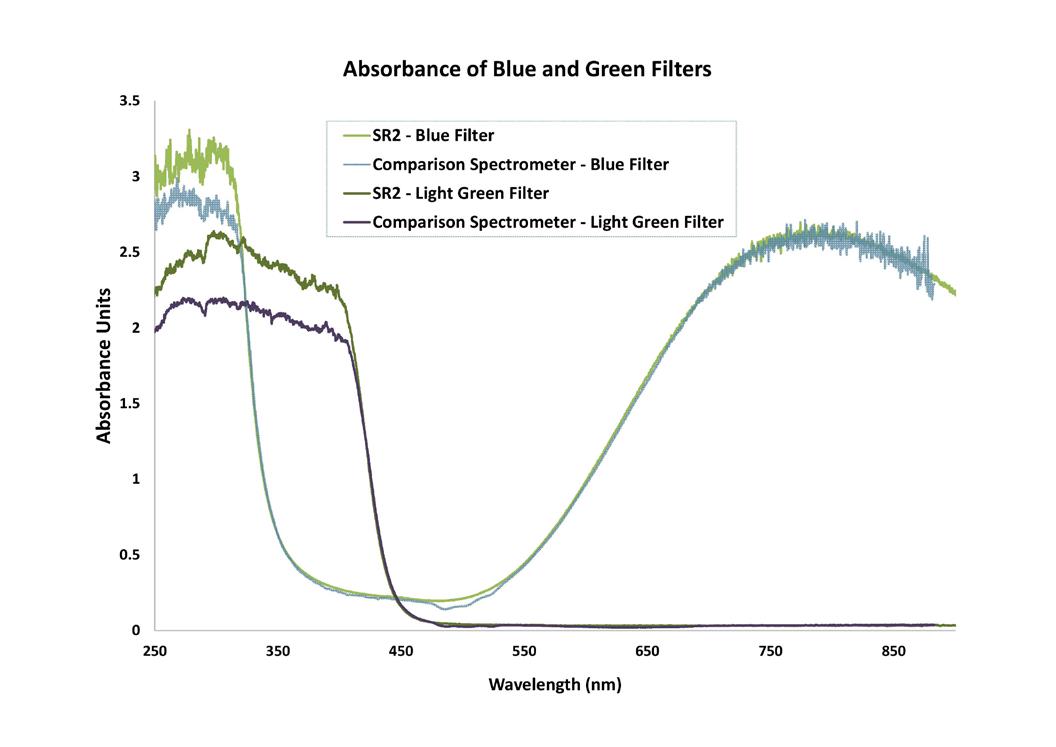
Figure 1. When blue filters are measured, the lower noise level of the SR2 delivers better SNR at longer wavelengths than a comparable spectrometer.
To ensure best results for similar measurements, be sure to warm up the light source for the recommended amount of time (up to 30 minutes in some cases). Light source output will continue to change very slightly until the source is in thermal equilibrium, affecting measurements. Also, never turn off the light source or disconnect fibers to take a dark measurement. Instead, block the light source at its origin, or at the filter slot in the sample holder. Make sure the object used will block 100% of the light; metal works well.
Absorbance of Potassium Dichromate Standards
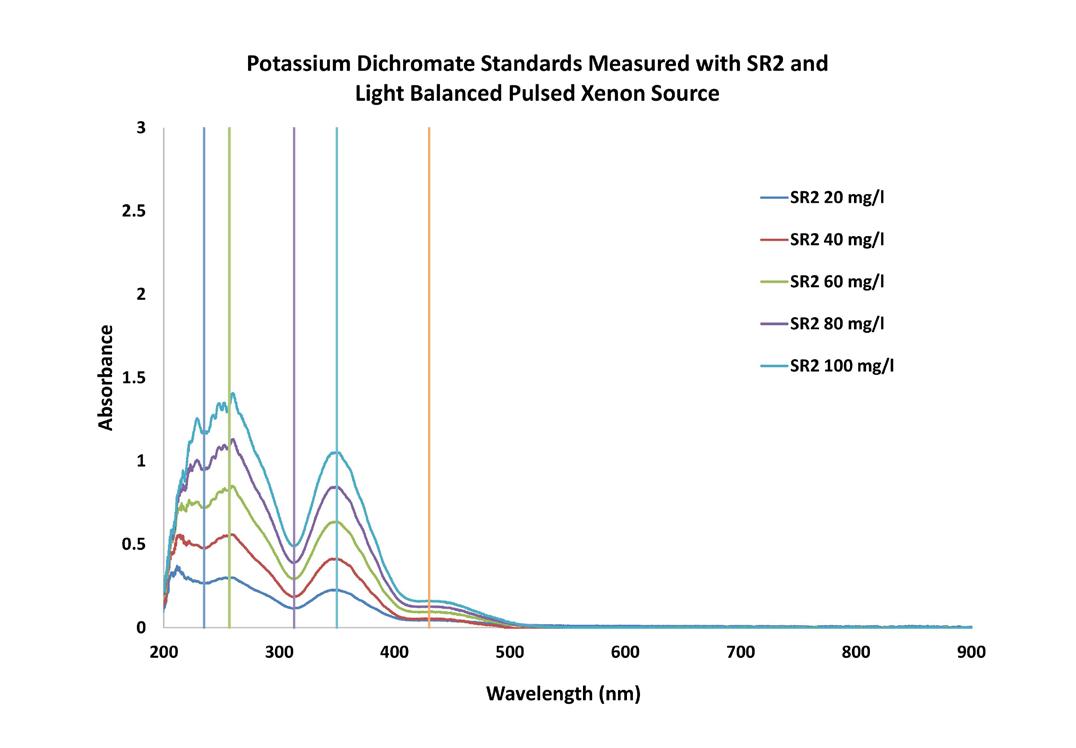
Figure 2. In these measurements, the vertical lines represent calibrated absorbance wavelengths at 235 nm, 257 nm, 313 nm, 350 nm and 430 nm.
Potassium dichromate is a crystalline solid typically used as an oxidizing agent. In this instance, we used potassium dichromate solution standards to compare the SR2 measurements to the calibrated absorbance wavelengths at 235 nm, 257 nm, 313 nm, 350 nm and 430 nm.
Our setup comprised an SR2 UV-Visible spectrometer with 50 μm slit, a PX-2 pulsed xenon light source balanced using a filter holder and diffuser, the 1 cm pathlength Square One cuvette holder, and a pair of 600 μm solarization-resistant optical fibers. The SR2 demonstrated high accuracy, especially at higher concentration measurements (Figure 2).
Generally, with absorbance measurements it’s best to set the spectrometer integration time so that the reference spectrum peaks at 80%-90% of the full scale of counts. This lets you take advantage of the full dynamic range of the spectrometer, which improves signal-to-noise performance. Also, because the SR2 spectrometer has a balanced output across its entire wavelength range, users can avoid saturating certain parts of the spectrum -- and having to make potentially unwelcome measurement trade-offs.
Signal-to-Noise Ratio (SNR) and SR2
In the context of absorbance measurements, spectrometer SNR can be the difference between excellent results and something less than that. We’ve observed how the SR2 outperforms a comparable spectrometer for absorbance measurements, especially in the UV. This is one reason why the SR2 is appealing for applications such as molecular diagnostics.
For context, SNR is the signal intensity divided by the noise intensity at a certain signal level, which means SNR can vary from measurement to measurement. Since system noise typically increases as a function of signal due to photon noise, the SNR function is a plot of individual SNR values versus the signal at which they were obtained.
Ocean Optics reports SNR for its spectrometers as the maximum possible SNR value measured at detector saturation. The SNR response curve for each pixel is assumed to be the same.
SNR can be improved by using different types of signal averaging, as we did for most of our measurements here. For time-based averaging, the SNR will increase by the square root of the number of spectral scans used. For example, an SNR of 380:1 for a single scan increases to 3800:1 if 100 scans are averaged. For spatially based averaging (boxcar), the SNR will increase by the square root of the number of pixels averaged.
Also, SNR can be dramatically enhanced using the High Speed Averaging Mode available in OceanDirect. Visit our website for details.
Additional Applications
While the SR2 is an excellent option for absorbance measurements, its versatility extends to other applications. For example, for irradiance calibrated measurements like solar irradiance, the SR2 is able to detect high-resolution spectral peaks as well as less obvious features in the spectrum. The spectrometer is also useful for measuring high-intensity light sources and high-energy plasmas.
Article Source: www.oceaninsight.com/globalassets/catalog-blocks-and-images/app-notes/sr2-spectrometer-excels-for-absorbance-measurements.pdf