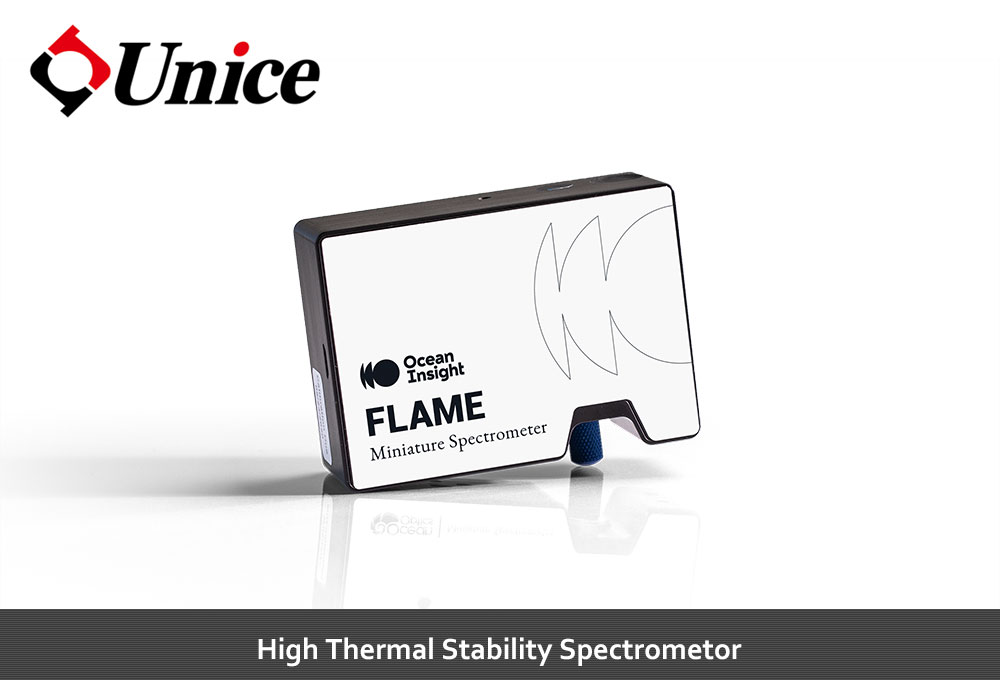
FLAME-T-VIS-NIR
FLAME-T-VIS-NIR
產品型號:FLAME-T-VIS-NIR
產品說明:
產品說明:
-
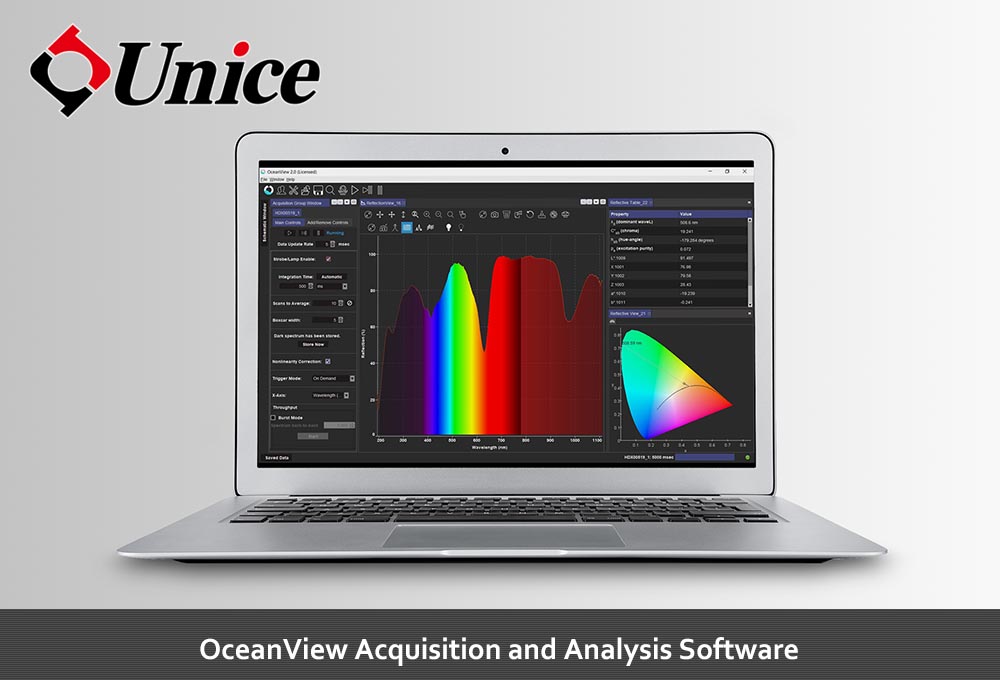
Flame series spectrometers combine heritage, creativity and insight to deliver all the benefits of miniature, modular spectroscopy — without comprise.
These compact, next-generation spectrometers integrate performance-enhancing features and are produced using industry-leading manufacturing techniques. Enjoy the benefits of greater thermal stability and lesser unit-to-unit variability, plus the freedom of interchangeable slits, simple device connectors and LED status indicators.