| Engineering Specifications |
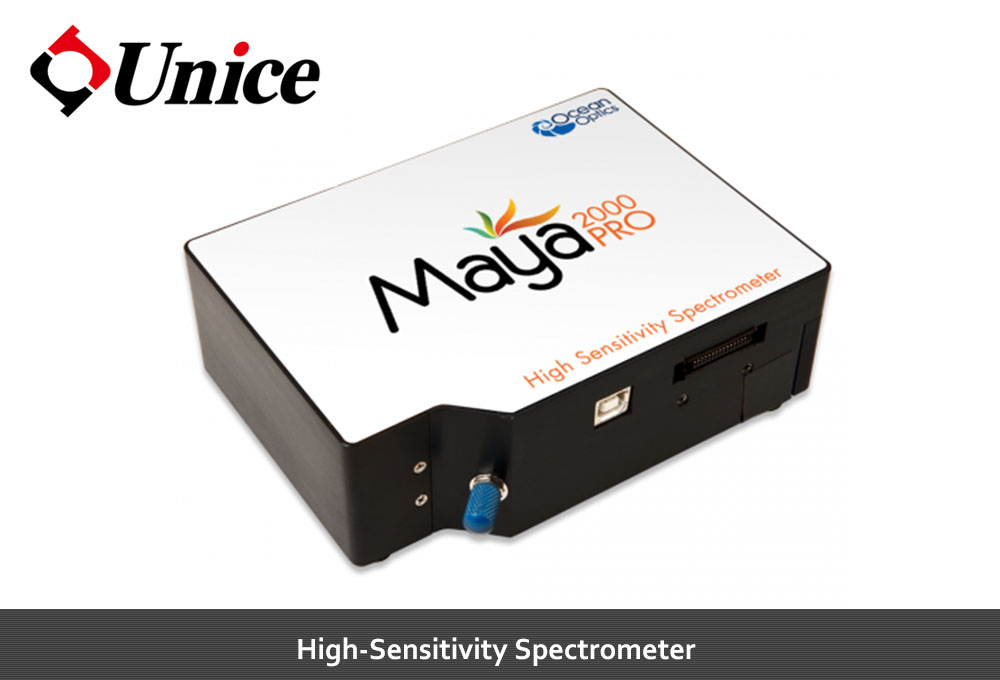
Maya2000 Pro-NIR |
| PHYSICAL |
| Dimensions: |
148.6 x 109.2 x 46.4 mm without feet
148.6 x 109.2 x 49.3 mm with feet |
| Weight: |
0.96 kg (2.1 lb.) |
| DETECTOR |
| Type: |
Back-thinned, 2D |
| Detector: |
Hamamatsu S11510 (uncooled) |
| Quantum efficiency: |
~85% peak QE @ 700 nm; 40% QE @ 1000 nm |
| SPECTROSCOPIC |
| Spectral range (preset): |
780-1180 nm |
| Optical resolution (FWHM): |
~0.82 nm |
| Signal-to-noise ratio at full signal: |
~450:1 |
| Grating: |
Grating #H14 |
| Dynamic range: |
15000:1 (typical) |
| Integration time: |
7.2 ms-5 seconds |
| Fiber optic connector: |
SMA 905 to 0.22 numerical aperture single-strand optical fiber |
| ELECTRONICS |
| Power requirement: |
500 mA @ +5 VDC |
| Trigger modes: |
4 modes |
| Strobe functions: |
Yes |
| Interfaces: |
USB 2.0, RS-232 |
| ENVIRONMENTAL CONDITIONS |
| Temperature: |
0 °C to +50 °C (operation) |
| Humidity: |
0-90% non-condensing |
OceanView - Software (Option)
OceanView is our flagship desktop spectroscopy application. Available for Windows, MacOS and Linux, it provides full control of all Ocean Optics spectrometers. OceanView is the recommended software for use with Ocean Optics spectrometers.
Automated Wizards
OceanView provides numerous automated Wizards ready to walk you through complex spectroscopy and color processing tasks. Just select the task you wish to perform (absorbance, Raman, colormetrics etc), and intuitive forms will walk you through each step in data collection and process configuration.
Schematic View
Beyond simple “scope mode” visualization, OceanView allows you to generate, edit and export complete spectral process flow diagrams using a natural “schematic” dataflow. Anyone familiar with LabVIEW or similar tools will be instantly at ease in this straightforward diagram-based process model.
Create, configure, and connect schematic nodes to read data from devices, transform and combine that data through a library of built-in spectroscopic functions, and then output the results to visual graphs and Excel-ready CSV files.
Color Processing
Data Collection
Whether you need to carefully capture events at faster-than-human timescales, or if you just want to leave an extended test running over a 3-day weekend, OceanView is able to log the data you need for post-action analysis. Spectra can be saved singly as snapshots, or streamed to a continually-growing table which can be opened directly to Excel for evaluation and charting. You can save full spectra in either mode, or select specific wavelengths or ranges for focused strip-charts over time.