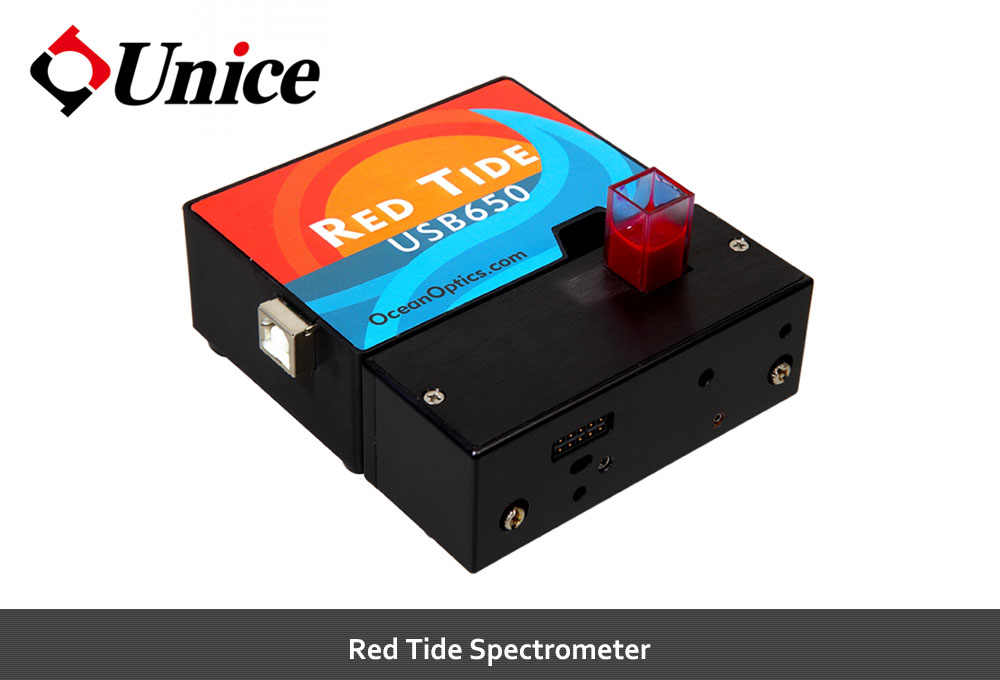
| Physical Specifications |
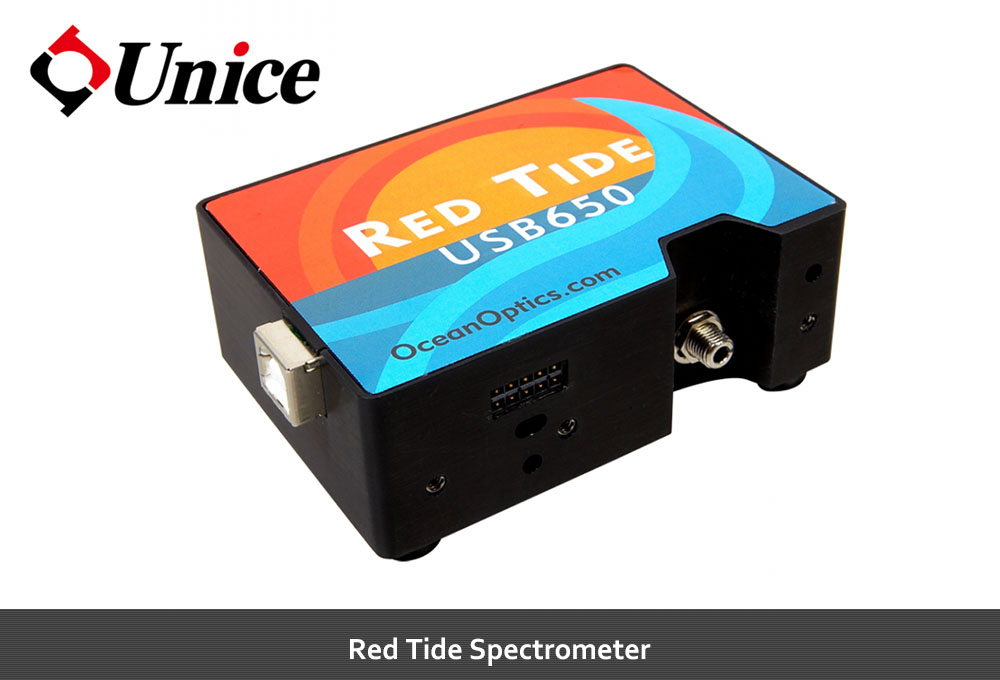
USB-650-VIS-NIR |
| Dimensions: |
89.1 mm x 63.3 mm x 34.4 mm |
| Spectrometer weight: |
190 g |
| Detector Specifications |
| Detector: |
Linear silicon CCD array |
| Pixels: |
650 enabled pixels |
| Pixel size: |
14 µm x 200 µm |
| Pixel well depth: |
~62,500 electrons |
| Sensitivity: |
75 photons/count at 400 nm |
| Optical Bench |
| Design: |
f/4, Asymmetrical crossed Czerny-Turner |
| Focal length: |
42 mm input; 68 mm output |
| Entrance aperture: |
25 µm wide slit |
| Fiber optic connector: |
SMA 905 |
| Spectroscopic |
| Wavelength range: |
350-1000 nm |
| Optical resolution: |
~2.0 nm FWHM |
| Signal-to-noise ratio: |
250:1 (maximum signal) |
| A/D resolution: |
12 bit |
| Dark noise: |
3.2 RMS counts |
| Integration time: |
3 ms to 65 seconds (15 s typical max) |
| Dynamic range: |
8.5 x 10⁷ (system); 1300:1 for a single acquisition |
| Stray ligth: |
<0.05% at 600 nm; 0.10% at 435 nm |
| Corrected linearity: |
>99% |
| Cuvette holder-light source: |
Included |
| Light source: |
tungsten |
| Couple to optical fibers: |
No |
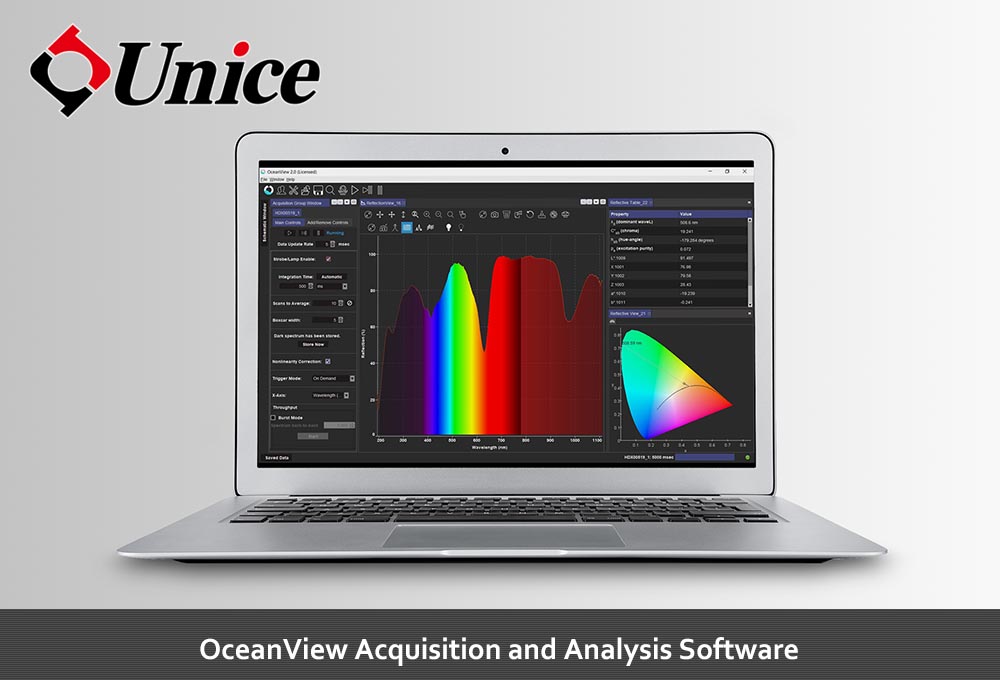
OceanView - Software (Option)
OceanView is our flagship desktop spectroscopy application. Available for Windows, MacOS and Linux, it provides full control of all Ocean Optics spectrometers. OceanView is the recommended software for use with Ocean Optics spectrometers.
Automated Wizards
OceanView provides numerous automated Wizards ready to walk you through complex spectroscopy and color processing tasks. Just select the task you wish to perform (absorbance, Raman, colormetrics etc), and intuitive forms will walk you through each step in data collection and process configuration.
Schematic View
Beyond simple “scope mode” visualization, OceanView allows you to generate, edit and export complete spectral process flow diagrams using a natural “schematic” dataflow. Anyone familiar with LabVIEW or similar tools will be instantly at ease in this straightforward diagram-based process model.
Create, configure, and connect schematic nodes to read data from devices, transform and combine that data through a library of built-in spectroscopic functions, and then output the results to visual graphs and Excel-ready CSV files.
Color Processing
Data Collection
Whether you need to carefully capture events at faster-than-human timescales, or if you just want to leave an extended test running over a 3-day weekend, OceanView is able to log the data you need for post-action analysis. Spectra can be saved singly as snapshots, or streamed to a continually-growing table which can be opened directly to Excel for evaluation and charting. You can save full spectra in either mode, or select specific wavelengths or ranges for focused strip-charts over time.